P&L Teardown · Episode 1 of 5. This series uses Allbirds' own public filings to show where its money went and what founders and marketers can learn from it. This episode is the big picture. The next four go deeper, and a bonus episode at the end digs into where $108M of sales went.
Allbirds' marketing wasn't what sank it. Its overhead was. In 2024, every $1 Allbirds spent on marketing brought in about $4.56 in sales, roughly twice what it needed to break even. But $70 of every $100 in sales went to simply running the company, so it lost about $51 on every $100 it sold. This post walks through where Allbirds' money went using its own public filings, explains the numbers in plain English, and gives you a simple formula to work out how much overhead your own brand can afford at its marketing efficiency.
Who is Allbirds?
Allbirds is a San Francisco shoe brand founded in 2016, best known for its wool sneakers and its sustainability story. It sold mostly direct to customers, online and through its own stores, and later, in some countries, through local partner companies that bought its shoes and resold them.
Customers loved the product. In 2020, about 53% of its sales came from repeat customers, and its Net Promoter Score stayed at 83 or higher. Revenue peaked at $297.8M in 2022.
Before the IPO: almost profitable
Allbirds had never turned a profit, but it was close. In 2019, after paying for the product and the marketing, it kept about $28 of every $100 in sales, and lost only about $4.65 per $100 once overhead was added.
In November 2021 it went public at $15 a share, raised about $300M, and closed its first day valued at roughly $4.1B. The plan was growth, including a ramp toward "hundreds" of stores. The store count went from 27 in mid-2021 to about 60 by the end of 2023.
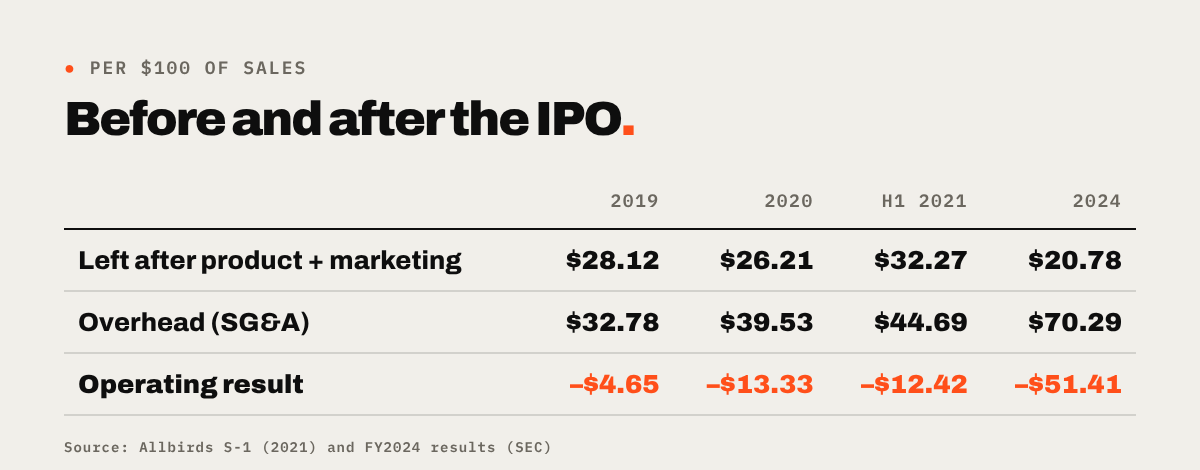
The pattern in that table is the whole story: overhead grew faster than sales. In 2019, overhead was about $33 of every $100. By 2024 it was $70. Meanwhile, what was left after product and marketing shrank from about $28 to about $21.
The rule that follows: if your losses grow faster than your revenue, growth is not the fix. Scale when each order makes money and your losses shrink as a share of sales.
Where $100 of Allbirds sales went in 2024
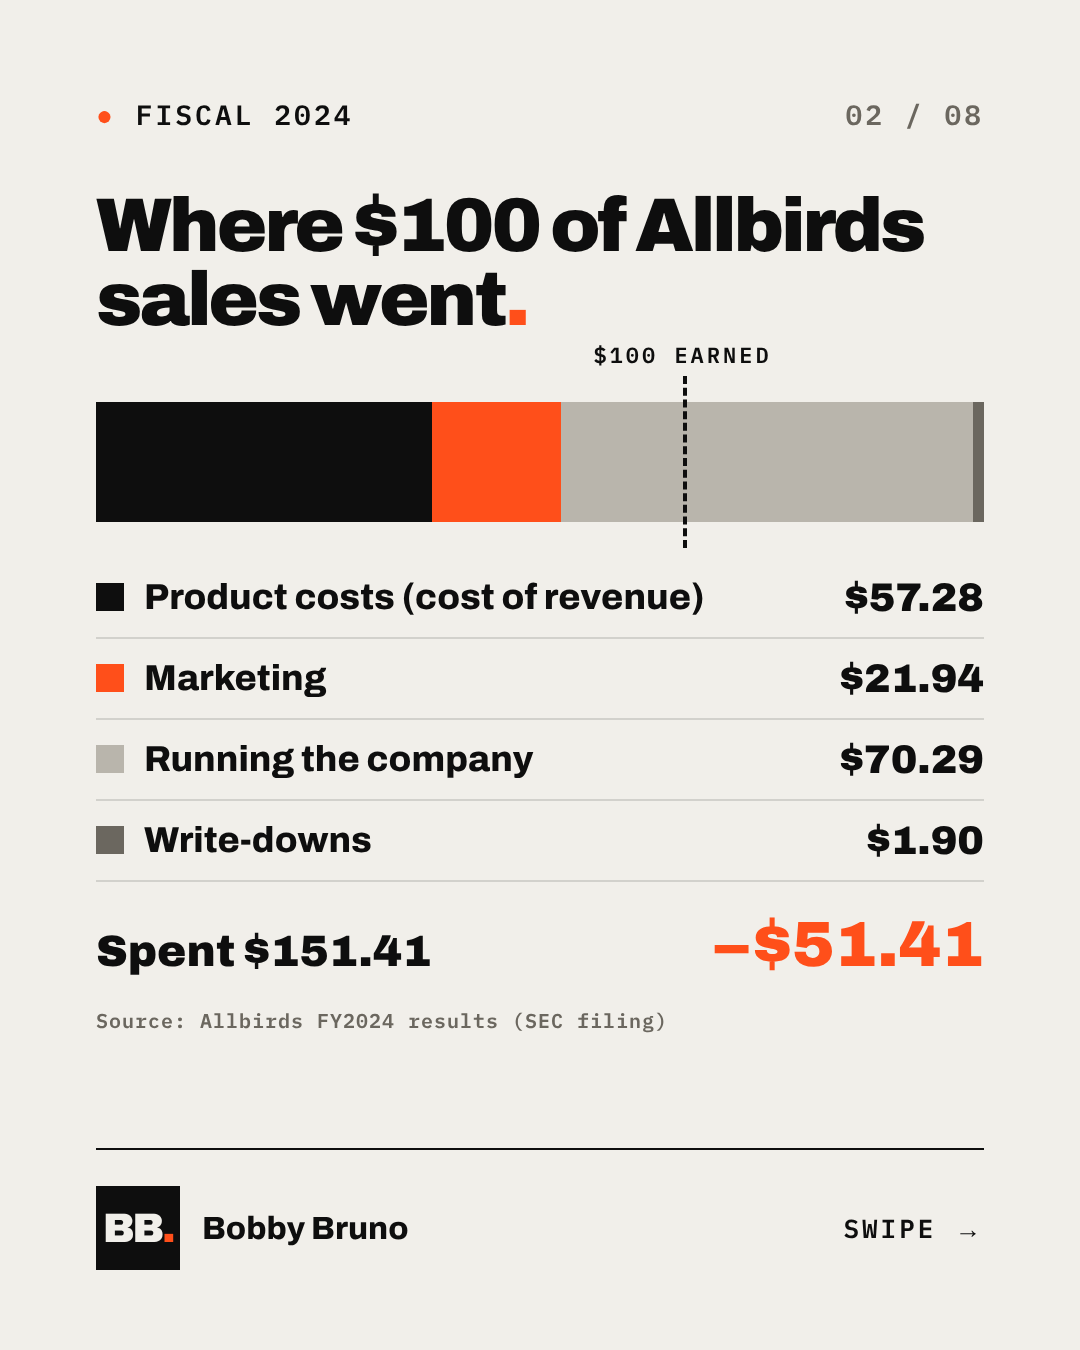
- $57.28 to product costs (cost of revenue)
- $21.94 to marketing
- $70.29 to running the company (SG&A)
- $1.90 to restructuring and write-downs
That adds up to $151.41 spent for every $100 sold, an operating loss of $51.41 per $100. These figures come straight from Allbirds' full-year 2024 results: $189.8M in revenue against $287.3M in total costs.
Free tool
Find out where your $100 goes.
Get the Marketing P&L Scorecard: find your profitable channels, your break-even MER and how much overhead you can afford, in about 15 minutes.
Check your inbox.
Your Marketing P&L Scorecard is on its way. Not there in a few minutes? Check your spam or promotions folder.
Want a second pair of eyes on your numbers? Book a free 30-minute intro call and we'll walk through your scorecard together.
Book a call →What is SG&A?
SG&A stands for selling, general and administrative expenses. It's the cost of running the company that isn't the product itself and, in Allbirds' reporting, isn't marketing. Think salaries, store rent and staff, offices, software, depreciation, stock compensation and professional fees.
What makes SG&A dangerous is that most of it is fixed. It doesn't shrink on its own when sales slow. A lease, a team or a store keeps costing the same whether you sell $300M or $190M.
Was marketing the problem? Look at the MER
MER (marketing efficiency ratio) is total revenue divided by total marketing spend. It tells you how many dollars of sales each marketing dollar is associated with.
- Allbirds 2023: $254.1M ÷ $49.0M = 5.18
- Allbirds 2024: $189.8M ÷ $41.6M = 4.56
Your break-even MER is 1 divided by your gross margin. At Allbirds' 42.7% gross margin, that's 2.34: each marketing dollar needs to bring in at least $2.34 in sales just to pay for the product and the marketing itself. Allbirds was at about twice that. By that measure, its marketing was doing its job.
The real question: at Allbirds' MER, what should overhead have been?
Here's the formula every founder should know:
Maximum overhead % = gross margin % − (1 ÷ MER)
For Allbirds in 2024: 42.7% − (1 ÷ 4.56 = 21.9%) = 20.8% of revenue. That's the most it could spend on overhead and still break even. For a 10% operating profit, overhead would need to be around 10.8%.
Actual overhead, including write-downs, was about 72%. On $190M of sales, break-even overhead was about $39M. Allbirds spent about $137M, roughly 3.5 times too much. No marketing efficiency could have closed that gap: even with zero marketing spend, gross margin (42.7%) was smaller than overhead.
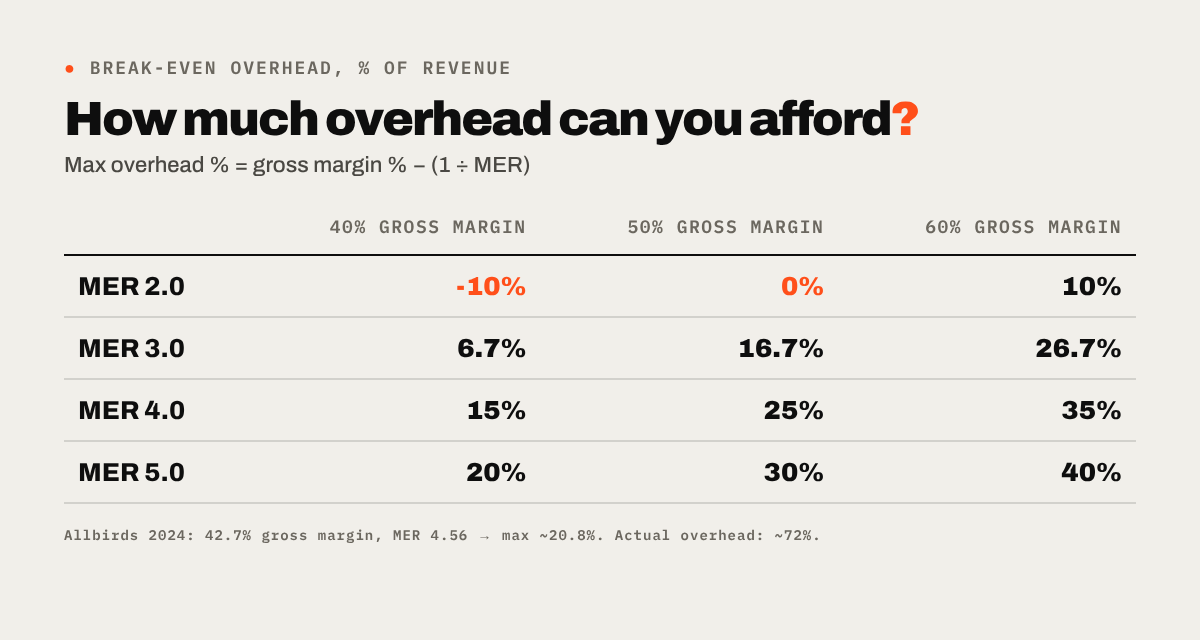
Find your gross margin and your MER, and the table tells you the most overhead your brand can carry before every sale starts losing money.
The 2025 bet: buying awareness
In 2025, Allbirds increased marketing even as sales fell. In the first quarter, it raised marketing to $12.0M, up from $7.8M a year earlier, mostly to fund a new brand campaign, including a video series hosted by Stanley Tucci called "Cards on the Table." Sales still fell, from $39.3M to $32.1M. The company reported more than 25 million Instagram views and collaboration posts reaching up to 100 times its usual audience.
The reach was real. The sales didn't follow. Full-year 2025 revenue fell another 19.7%, to $152.5M, and the marketing efficiency ratio dropped to roughly 3.0, based on outside estimates of 2025 marketing spend. Part of the revenue decline was structural: Allbirds closed stores and, in several countries, stopped selling directly and let local partner companies sell the shoes instead. Those partners buy at wholesale prices, so each pair sold brings in less revenue for Allbirds, by design.
The lesson isn't that brand campaigns are bad. It's that awareness spending has to earn its money back, and it usually takes time. Before an awareness campaign, any brand should be able to answer five questions:
- Payback: how long until this spend returns more than it costs?
- Runway: do we have the cash to wait that long?
- Measurement: how will we know it worked: branded search, new customers, incrementality tests?
- Brand recall: will people remember the brand, or just the celebrity?
- Availability: when new people go looking for us, can they easily buy, and does what they see match what the ads say?
Awareness and availability have to move together
The fifth question is where the 2025 plan worked against itself. While Allbirds was paying to put the brand in front of millions of new people, it was shrinking the number of places those people could buy it. It closed 14 U.S. stores in 2024 and nine more in the first half of 2025, and in several countries stopped selling directly, handing sales over to local partner companies. In January 2026 it announced it would close all of its remaining full-price U.S. stores. From just over 60 stores at its 2023 peak, it went down to four company-run locations.
Closing stores that lose money can be the right financial decision on its own. The problem is doing it at the same time as a big awareness push. It makes the product harder to buy for the very people the ads are trying to reach. And it sends two opposite messages: the ads say the brand is moving forward, while closed storefronts and headlines about closures say it's pulling back. When the advertising and the news tell different stories, the advertising has to work harder to be believed.
Awareness spending only pays off if the people it reaches can easily find and buy the product, and if everything else they hear about the brand backs up the ad.
How it ended
Allbirds' 2025 annual report included a warning of "substantial doubt" about its ability to continue as a going concern. In March 2026 it agreed to sell its brand and intellectual property to American Exchange Group for about $39M. The sale was completed and the remaining public company was renamed Smartbird. A brand once valued at about $4B on its first day of trading sold for roughly 1% of that.
What every founder should take from this
- Know your three numbers: contribution margin per order, MER compared with your break-even MER, and the maximum overhead your margins can support.
- Size overhead to the business you have, not the one you hope to become. Overhead is easy to add and hard to cut.
- Watch losses as a share of sales. If they grow as you grow, stop and fix the model before scaling.
- Match your marketing playbook to your P&L. A big-brand awareness strategy needs big-brand cash.
- Grow awareness and availability together. Don't pay to bring new people in while making it harder for them to buy, and make sure the rest of the brand's story matches the ads.
Allbirds had a product people loved and marketing that paid for itself. What it didn't have was a cost structure that fit. That's why marketing decisions are financial decisions.
Next in the P&L Teardown series
- Episode 2: The hidden MER. About half of Allbirds' sales came from repeat customers. Take them out, and what was a new customer really costing?
- Episode 3: $5 from profitable. Allbirds before the IPO, and the small changes that could have closed the gap.
- Episode 4: What an awareness campaign has to earn back. How to work out the payback on brand spend before you commit to it.
- Episode 5: How to read your own numbers. The same teardown, applied to your brand.
- Bonus: Where $108M of sales went. Allbirds' sales fell from $298M to $190M in two years. We break down how much came from discounting, closing stores, selling fewer pairs and tougher competition.
Sources and resources
- Allbirds S-1 registration statement (SEC, 2021)
- Allbirds Q4 and full-year 2024 results (SEC)
- Allbirds Q3 2025 results (SEC)
- Allbirds 2025 annual report, Form 10-K (SEC)
- Allbirds asset purchase agreement announcement, Form 8-K (SEC)
- Allbirds Q1 2025 prepared remarks (MarketScreener)
- Retail Dive: Allbirds closing all full-price US stores
- CNBC: Allbirds files for IPO and reveals continued losses
- Retail TouchPoints: Allbirds IPO pushes valuation above $4 billion
- Yahoo Finance: Allbirds unveils its "Allbirds by Nature" marketing platform
- Retail Insight Network: Allbirds sells IP, rebrands as Smartbird
- TradingView: Allbirds 2025 10-K summary
- Eightx: Allbirds teardown (revenue history and marketing estimates)

Bobby Bruno
About the author · Fractional CMO
Fractional CMO for e-commerce brands. I've helped generate about $75M in sales across 14 brands, and I run marketing the way an owner would: by the P&L.
Book a free intro call →